



Most oscillators make you choose between two evils. Smooth them and they react late. Make them fast and they twitch on every candle. The center of gravity oscillator, built by John Ehlers, tries to dodge that trade-off by measuring something different: where the “balance point” of recent prices sits inside a fixed window. In this guide we walk through the idea, the formula, a fully worked example with simple numbers, and how we’d actually use it on an Indian stock or index chart.
In this article
Where the idea of a center of gravity oscillator comes from
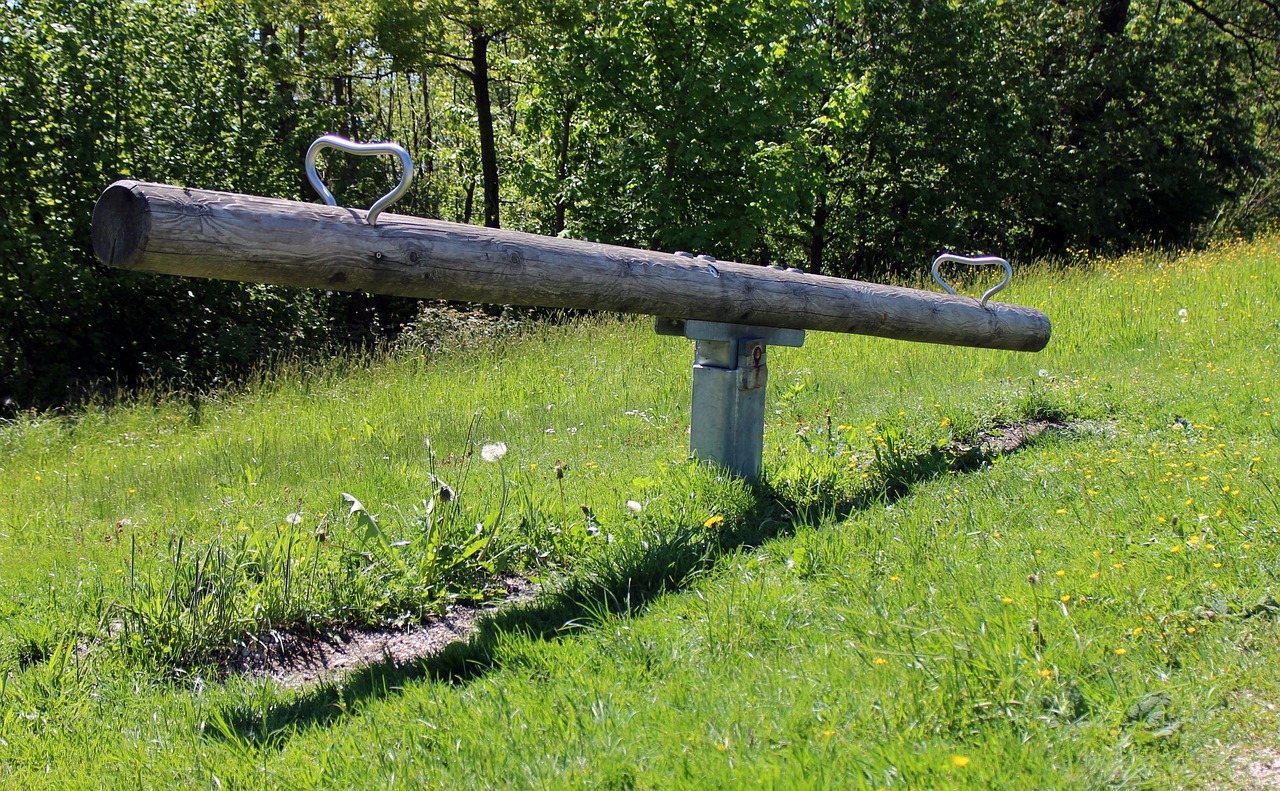
Ehlers explains the concept in his paper The CG Oscillator, and he uses a ruler to do it. Balance a 12-inch ruler on your finger and the balance point is at 6 inches. Clip a paper clip to one end and the balance point slides towards the clip.
Now swap the ruler for a chart. Each bar inside your lookback window is a weight, and the price is how heavy that weight is. When recent prices rise sharply, the heavier weights pile up at the recent end of the window, and the balance point moves that way. When prices fall, it slides back towards the older end.
Ehlers says he stumbled on this while debugging adaptive filters. He noticed the CG of his filter moved in exact opposition to price swings when measured as a distance from the latest bar. Flip the sign, and you get a line that moves with price, is already smoothed, and in his words has “essentially zero lag.” That is the whole trick.
A quick detour: why moving averages lag
To see why this matters, think about a simple moving average. Every bar in it carries the same weight, so its balance point sits right in the middle of the window. A 10-bar SMA is effectively describing where price was about five bars ago. That’s your lag.
A weighted moving average gives the newest bar the biggest weight and the oldest the smallest. The weights form a triangle, and the balance point of a triangle sits one-third of the way along its base. So the WMA’s centre of gravity is closer to the present, and it lags less. Ehlers’ point is that the position of the centre of gravity and the lag of a filter are two sides of the same coin. The CG oscillator simply tracks that position directly.
The oscillator isn’t measuring how far price moved. It’s measuring where, inside the window, the weight of price is sitting right now.
The center of gravity oscillator formula
Ehlers counts bars backwards from the current one. The latest bar is position 0, the one before it is position 1, and so on up to Length minus 1. The calculation is:
- Numerator = sum of (position + 1) multiplied by the price at that position, across the window
- Denominator = sum of the prices across the window
- CG = minus (Numerator divided by Denominator)
The “+1” is there because the newest bar is at position 0. Multiply its price by zero and it vanishes from the calculation, which would be silly for an indicator that’s supposed to react quickly. Adding one keeps it in.
In the paper’s sample code, the default price input is the bar’s midpoint, (High + Low) / 2, and the default length is 10. The signal line is nothing fancy. It’s just the CG value from one bar earlier. Because the CG line is already smooth, Ehlers argues that a one-bar delay is enough to create clean crossovers.
One practical point. The raw values are negative and hover around a level set by the window length, not around zero. With a 10-bar window, the CG will sit somewhere near minus 5.5 when prices are flat, because that’s the balance point of ten equal weights. Don’t hunt for a zero line. Watch the direction of the line and its crossovers instead.
Worked example: calculating the CG by hand
Let’s use a short window so the arithmetic stays readable. Below are 12 made-up closing prices for an imaginary stock. These are illustrative numbers, not real market data. We’ll use a 6-bar window.
| Bar | Price (Rs) |
|---|---|
| 0 | 100 |
| 1 | 102 |
| 2 | 104 |
| 3 | 103 |
| 4 | 101 |
| 5 | 99 |
| 6 | 98 |
| 7 | 100 |
| 8 | 103 |
| 9 | 106 |
| 10 | 108 |
| 11 | 107 |
Take bar 5 as the first full window. Counting backwards from bar 5, the prices are 99 (position 0), 101 (1), 103 (2), 104 (3), 102 (4) and 100 (5).
Numerator = 1×99 + 2×101 + 3×10³ + 4×10⁴ + 5×10² + 6×100 = 99 + 202 + 309 + 416 + 510 + 600 = 2,136.
Denominator = 99 + 101 + 103 + 104 + 102 + 100 = 609.
CG = −2,136 / 609 = −3.5074.
Repeat that for every bar and you get this:
| Bar | Price | Numerator | Denominator | CG | Signal (previous CG) |
|---|---|---|---|---|---|
| 5 | 99 | 2,136 | 609 | −3.5074 | – |
| 6 | 98 | 2,143 | 607 | −3.5305 | −3.5074 |
| 7 | 100 | 2,136 | 605 | −3.5306 | −3.5305 |
| 8 | 103 | 2,116 | 604 | −3.5033 | −3.5306 |
| 9 | 106 | 2,105 | 607 | −3.4679 | −3.5033 |
| 10 | 108 | 2,113 | 614 | −3.4414 | −3.4679 |
| 11 | 107 | 2,141 | 622 | −3.4421 | −3.4414 |
Read it slowly, because the story is all there.
Price bottoms at 98 on bar 6. The CG keeps slipping on bars 6 and 7, though by bar 7 the fall has almost stalled (−3.5305 to −3.5306). On bar 8 the CG jumps above its signal line. That’s the bullish crossover, two bars after the low.
Price then climbs to 108 on bar 10. On bar 11, price dips to 107 and the CG drops below its signal for the first time since the turn. That’s the bearish crossover, one bar after the high.
Notice how small the numbers are. The whole swing from 98 to 108 moves the CG by less than 0.1. That’s normal. The absolute level tells you little; the slope and the crossovers do the talking.
Choosing the right length
This is the setting that makes or breaks the indicator, and Ehlers is specific about it. He says the ideal length is half the dominant cycle length, because half a cycle captures the full move in one direction.
Go too long and the oscillator goes numb. If your window spans one full cycle, half the data pulls the balance point one way and the other half pulls it back, so the CG barely moves. Go too short and you lose the smoothing, and the line gets, as Ehlers puts it, “a little too nervous for profitable trading.”
So how do you find the dominant cycle on, say, a Nifty 50 daily chart? A rough method is to measure the distance in bars between a few recent swing lows and take an average. If swing lows tend to come about 20 bars apart, try a length of 10. Ehlers also builds cycle-measuring tools for this, and we’ve covered a couple of them, like the Ehlers Sinewave indicator and the Ehlers Cyber Cycle indicator. If you already use one of those, you can feed its cycle reading straight into your CG length.
Get the length wrong and the best formula in the world gives you either a flat line or a nervous one.
How we’d read it on a chart
1. Crossovers as timing, not as direction
CG crossing above its one-bar-old self is a hint that the balance of recent prices has tipped forward. Crossing below says it has tipped back. On a stock that’s been ranging between two clear levels, these crossovers can be tidy entry and exit cues.
In a strong trend, though, you’ll still see crossovers on every small pullback. That’s where many traders get chopped up. If the bigger picture is clearly trending, use the CG only to time entries in the trend’s direction, and ignore crossovers against it.
2. Pair it with a trend filter
A simple way to do this is to check where price sits against a longer moving average, or to use something like the Schaff Trend Cycle as a regime check. Take bullish CG crossovers only when the trend filter is up, bearish ones only when it’s down.
3. Respect support and resistance
A bullish crossover right under a heavy resistance zone is a weaker signal than one that fires just after price bounces off support. The oscillator doesn’t know where the levels are. You do. Our technical analysis guide for Indian stocks covers how to mark those levels before you lean on any indicator.
4. Use the bar midpoint, as Ehlers did
The paper’s code uses (High + Low) / 2 as the price input. That’s a sensible default for Indian equities, where opening gaps and closing auction moves can make the close a slightly noisy number. You can try closing prices too, but test both on the same stock before deciding.
Where the CG oscillator falls short
We like this indicator, but it isn’t magic, and it’s fair to be clear about its weak spots.
- It assumes a cycle exists. In a strong one-way trend there’s no clean cycle to measure, and the CG will keep flipping on minor pauses.
- Length sensitivity is real. The same stock can look brilliant with one setting and useless with another. Re-check the cycle length every few months, because it drifts.
- Tiny value ranges. As the worked example shows, the CG moves in small decimals. Some charting platforms scale it oddly, so zoom in on the indicator panel before judging crossovers.
- “Zero lag” is a claim about smoothing, not prophecy. In our example the crossovers came one and two bars after the actual turns. That’s quick, but it’s still after the fact.
- Gaps distort it. A big results-day gap drops a heavy weight into one end of the window, and the balance point jumps. Treat signals right after earnings with extra caution.
A simple CG trading checklist
- Estimate the dominant cycle on your timeframe and set the length to about half of it.
- Use (High + Low) / 2 as the input, unless testing shows the close works better for that stock.
- Decide the trend first, using a moving average or a trend-cycle tool.
- Take CG crossovers only in the trend’s direction, and only near meaningful support or resistance.
- Place a stop beyond the most recent swing, sized so one loss doesn’t hurt your account.
- Skip signals in the first session or two after a big gap, such as results day.
The center of gravity oscillator won’t replace your judgement. What it does well is give you a smoothed, fast read on whether recent prices are tilting forward or back. Use it with a sensible length and a trend filter, and it can sharpen your timing without adding much clutter to the chart.
Disclaimer: This article is for educational purposes only and is not investment advice. The prices in the worked example are illustrative and not real market data. Trading involves risk; consult a SEBI-registered investment adviser before making investment decisions.

Leave a Reply
Join the conversation
Commenting is open to registered readers. Sign up with just your email — no password needed, and it takes under a minute.
Sign up to comment Log in