



Most of the market talk you hear on any given day is about the Nifty 50 or the Sensex. The Nifty Next 50 index gets far less airtime, even though it holds names like Divi’s Laboratories, TVS Motor, Hindustan Aeronautics and Adani Power. It is, quite literally, the queue behind the Nifty 50. Companies wait here to be promoted, and a company dropped from the Nifty 50 that is still in the Nifty 100 lands here, as Wipro did in September 2026.
We think it is one of the more useful indices to understand properly, because its rules tell you a lot about how NSE Indices thinks about size, liquidity and derivatives. So let us take it apart: what it holds, how a stock gets in, why some of its biggest members still could not get promoted in the last review, and what the odd-sounding “non-F&O cap” actually does.
In this article
- What the Nifty Next 50 index actually is
- How a stock gets into the Nifty Next 50 index
- Why the Nifty 50 is harder to reach
- What changed in the September 2026 rejig
- The non-F&O caps, explained
- What sits inside the index right now
- Returns and risk: what the factsheet says
- How to use the Nifty Next 50 index sensibly
What the Nifty Next 50 index actually is
The definition is short. The NSE Indices page for the index says it “represents 50 companies from Nifty 100 after excluding the Nifty 50 companies.” That is the whole selection rule. There is no separate screening committee picking the Next 50 by hand. Once the Nifty 100 and the Nifty 50 are decided, whatever is left over in the Nifty 100 becomes the Next 50.
Some basic facts from NSE Indices:
- Base value: 1,000, with a base date in November 1996, according to the NSE Indices methodology document (November 2026) and the index factsheet.
- Weighting: free-float market capitalisation, a method the index has used since May 4, 2009, per the index page. If you want a refresher on how free float works, we covered it in our piece on free-float market capitalisation.
- Size: about 11.43% of the free-float market capitalisation of stocks listed on NSE as on September 30, 2026.
- Trading activity: the constituents accounted for roughly 10.52% of the traded value of all NSE stocks over the six months ending September 2026.
- Calculation: real-time, with a semi-annual review.
So in plain terms, this basket of 50 companies is roughly a tenth of the listed market by free float and by trading. That is not small. It is just overshadowed by the bigger 50 sitting above it.
How a stock gets into the Nifty Next 50 index
Because the Next 50 is “Nifty 100 minus Nifty 50”, the real gatekeeper is the Nifty 100. The methodology says the Nifty 100 represents the top 100 companies by full market capitalisation from the Nifty 500. To even be considered, a company has to be in the Nifty 500, and it has to pass a free-float test: an investible weight factor (IWF) of at least 0.10, which means at least 10% free float, or a free-float market cap of at least 25% of the full market cap of the smallest existing Nifty 100 member.
Then come the inclusion and exclusion tests, which use six-month averages:
- Size leg: a stock is a candidate for inclusion if its average full market cap ranks within the top 90. The methodology also has a route for a stock whose average full market cap is at least 1.5 times that of the smallest Nifty 100 constituent.
- Liquidity leg: the candidate must either be available for trading in NSE’s Futures & Options segment, or have an average daily turnover higher than the 90th-ranked Nifty 100 stock by turnover.
- Exit: an existing member is excluded if its rank by average full market cap falls below 110.
- Limit: a maximum of five replacements per review.
Notice the gap between 90 and 110. A new stock has to climb into the top 90 to get in, but a sitting member only goes out once it slips past 110. The point of that 20-rank buffer, as we read it, is that a company hovering around rank 100 should not bounce in and out of the index every six months, forcing index funds to buy and sell it each time.
There is one more filter for non-F&O stocks. On a prospective basis, they are eligible only if the number of times they hit the upper or lower price band over the past six months is less than 20% of total trading days. If a stock hits both the upper and lower circuit on the same day, that counts as two instances. The point is obvious: a stock that keeps getting locked at its circuit limit is hard for a fund to trade in size.
The Next 50 has no selection rule of its own. Whatever the Nifty 100 holds, minus whatever the Nifty 50 takes, is what you get.
Why the Nifty 50 is harder to reach
Moving up from the Next 50 to the Nifty 50 is a different test. The methodology says the Nifty 50 picks from the Nifty 100 universe, needs stocks with average impact cost of 0.50% or less for 90% of observations on a Rs 10 crore basket, and requires derivative contracts on NSE. Only Nifty 100 stocks available in the F&O segment are eligible. For a non-member to replace an existing one, its free-float market cap must be at least 1.5 times that of the smallest Nifty 50 constituent. (Impact cost has its own quirks; we explained it in impact cost on NSE.)
That 1.5x hurdle is where the Next 50 story gets interesting.
Worked example: the two biggest Next 50 stocks that missed promotion
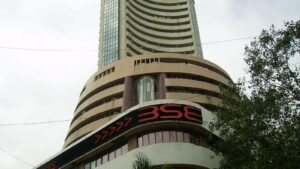
In its August 10, 2026 press release, NSE Indices announced that BSE Ltd. would replace Wipro in the Nifty 50, effective September 30, 2026 (close of September 29). BSE’s six-month average free-float market cap was Rs 1,40,879 crore against Wipro’s Rs 55,930 crore. That is about 2.52 times, comfortably above 1.5.
But the release also named the next two eligible companies, TVS Motor Company (Rs 84,566 crore) and Divi’s Laboratories (Rs 82,930 crore), and said they were not considered because they did not clear the 1.5x test against the two smallest remaining Nifty 50 members, HDFC Life Insurance (Rs 65,666 crore) and Tata Consumer Products (Rs 73,054 crore). Business Standard reported the same figures.
Run the numbers and you can see how wide the gap was:
- 1.5 x HDFC Life’s Rs 65,666 crore = Rs 98,499 crore.
- TVS Motor at Rs 84,566 crore was short by Rs 13,933 crore. It would have needed roughly 16.5% more average free-float market cap.
- Divi’s at Rs 82,930 crore was short by Rs 15,569 crore, or about 18.8% more.
- Against Tata Consumer, the bar was even higher: 1.5 x Rs 73,054 crore = Rs 1,09,581 crore.
Here is the part we like. In the Nifty Next 50 factsheet dated October 30, 2026, the two heaviest stocks in the index are Divi’s Laboratories at 5.24% and TVS Motor at 4.16%. The two largest members of the waiting room are exactly the two that were told to keep waiting. Being big is not enough. You have to be meaningfully bigger than the smallest stock you would push out.
What changed in the September 2026 rejig
The same press release shows how the Next 50 shifts as a knock-on effect of other decisions. Five companies left and five came in:
| Excluded from Nifty Next 50 | Included in Nifty Next 50 |
|---|---|
| Indian Hotels Co. | Hitachi Energy India |
| Lodha Developers | Polycab India |
| REC | Vedanta Aluminium Metal |
| Shree Cement | Vodafone Idea |
| United Spirits | Wipro |
Look at where each of these came from. All five exits were dropped from the Nifty 100, the parent, and the release lists all five among the additions to the Nifty Midcap 150. On the other side, Hitachi Energy, Polycab and Vodafone Idea moved up out of the Midcap 150. Wipro came down from the Nifty 50. And BSE, which was in the Midcap 150, skipped the Next 50 altogether and went straight into the Nifty 50 because it entered the Nifty 100 and cleared the Nifty 50 bar in the same review.
So the Next 50 is really a crossing point. Stocks arrive from below and above, and leave in both directions. If you track index changes for trading ideas, this is where the traffic is. We wrote about the full process, including notice periods, in how NSE decides which stocks enter and exit.
The non-F&O caps, explained
This is the rule that makes the Nifty Next 50 different from a plain free-float index. Per the methodology and factsheet:
- The cumulative weight of constituents not available for trading in the F&O segment is capped at 10% of the index.
- Each such non-F&O stock is individually capped at 4.5%.
- Both caps apply on quarterly rebalance dates. The capping factors are realigned when a stock is replaced, and every quarter on the last trading day of March, June, September and December, using closing prices on a T-3 basis (T being that last trading day).
Why does this exist? Our reading: index funds and ETFs tracking the Next 50 need to buy every constituent in proportion to its weight. A stock with F&O contracts usually has deeper liquidity and a way to hedge. Capping the non-F&O portion limits how much of a tracker’s money has to go into names that may be harder to trade.
Worked example: what a cap does to weights
These numbers are hypothetical, only to show the mechanics. Say a non-F&O stock, call it Company X, would have a 6% weight on pure free float. The 4.5% individual cap cuts it to 4.5%. The 1.5 percentage points it gives up have to go somewhere, because weights must add to 100%. In a simple proportional illustration, the other stocks, which held 94% together, would now hold 95.5%. Each of them grows by a factor of 95.5 / 94, or about 1.016. A stock that was at 3% moves to roughly 3.05%.
Now the group cap. Suppose all the non-F&O stocks together would weigh 13%. They must be squeezed to 10%, a scale-down to about 77% of their uncapped weights in this simple illustration. A non-F&O stock at 4% would end up near 3.08%.
Two things follow. First, between rebalance dates, a hot non-F&O stock can drift above 4.5% because prices move. The cap only snaps back on the next quarterly date. Second, when a capped stock gets F&O contracts, the cap no longer applies to it at the next realignment, and its weight can rise towards its free-float share. That can mean extra buying from trackers.
The cap is not a judgement on quality. It is a judgement on how easily a fund can trade the stock.
What sits inside the index right now
The October 30, 2026 factsheet gives this snapshot.
Top three sectors by weight: Capital Goods 19.71%, Financial Services 18.04% and Automobile and Auto Components 9.95%. Capital goods and financials together make up 37.75% of the index. Power (9.46%) and Healthcare (9.41%) follow. Information Technology is just 3.92%.
Top five stocks: Divi’s Laboratories 5.24%, TVS Motor 4.16%, Hindustan Aeronautics 3.88%, Tata Motors 3.50% and Adani Power 3.32%. Those five add up to 20.1%. The full top ten adds up to 33.87%,, so the index is fairly spread out: no single stock is above 5.5%.
Valuation: P/E of 17.13, P/B of 3.25 and dividend yield of 1.51%.
Returns and risk: what the factsheet says
All return figures below are from the factsheet as of October 30, 2026. Returns up to one year are absolute; longer periods are compound annual growth rates.
- 1-year price return: -3.03%. Total return (including dividends): -2.14%.
- 5-year price return CAGR: 9.98%. Total return CAGR: 10.95%.
- Price return since inception (CAGR): 15.08%.
- Year-to-date price return: -2.39%.
To put the five-year numbers in rupees: Rs 1 lakh compounding at 9.98% a year for five years grows to about Rs 1.61 lakh. At 10.95% it grows to about Rs 1.68 lakh. The difference of roughly Rs 7,200 is what dividends added on Rs 1 lakh over the period, before any fund costs. Past returns, of course, say nothing certain about the next five years.
On risk, the factsheet shows a one-year beta of 1.07 against the Nifty 50, a correlation of 0.85 and annualised standard deviation of 17.64%. In plain words: over the last year the Next 50 tended to move a little more than the Nifty 50, roughly 1.07% for every 1% move in the benchmark on average, and the two mostly moved together, but not perfectly. A 5% Nifty 50 fall would map to about a 5.35% fall if that beta held exactly, which in real markets it rarely does on any single day.
How to use the Nifty Next 50 index sensibly
A few practical points from all of this:
- It is still large-cap. Every stock here is inside the Nifty 100. People sometimes treat the Next 50 as a midcap fund. It is not. It is the lower half of the large-cap universe.
- Watch the 1.5x maths before a review. If a Next 50 stock is getting close to 1.5 times the smallest Nifty 50 member’s free-float value, it becomes a promotion candidate. The August release shows how far off even the biggest members can be.
- Read the sector mix, not just the name. With capital goods and financials at nearly 38%, adding a Next 50 fund to a Nifty 50 fund tilts your portfolio towards these two sectors. Check whether you want that tilt.
- Remember turnover. Five names changed in the September 2026 review alone. Each change forces trackers to buy and sell, and those trading costs can show up in a fund’s tracking difference.
- Check the date on every number. Weights, sector mix and returns change daily. The factsheet is monthly. Always go back to NSE Indices for the latest.
The short version: the Nifty Next 50 is not a separate universe. It is what is left after NSE builds the Nifty 100 and the Nifty 50, with a liquidity guardrail on top. Know those two parents, and you know why the Next 50 looks the way it does.
Disclaimer: This article is for education and information only. It is not investment advice or a recommendation to buy or sell any security, index fund or ETF. Index data comes from NSE Indices and can change; please check the latest figures and consult a SEBI-registered adviser before investing.

Leave a Reply
Join the conversation
Commenting is open to registered readers. Sign up with just your email — no password needed, and it takes under a minute.
Sign up to comment Log in