
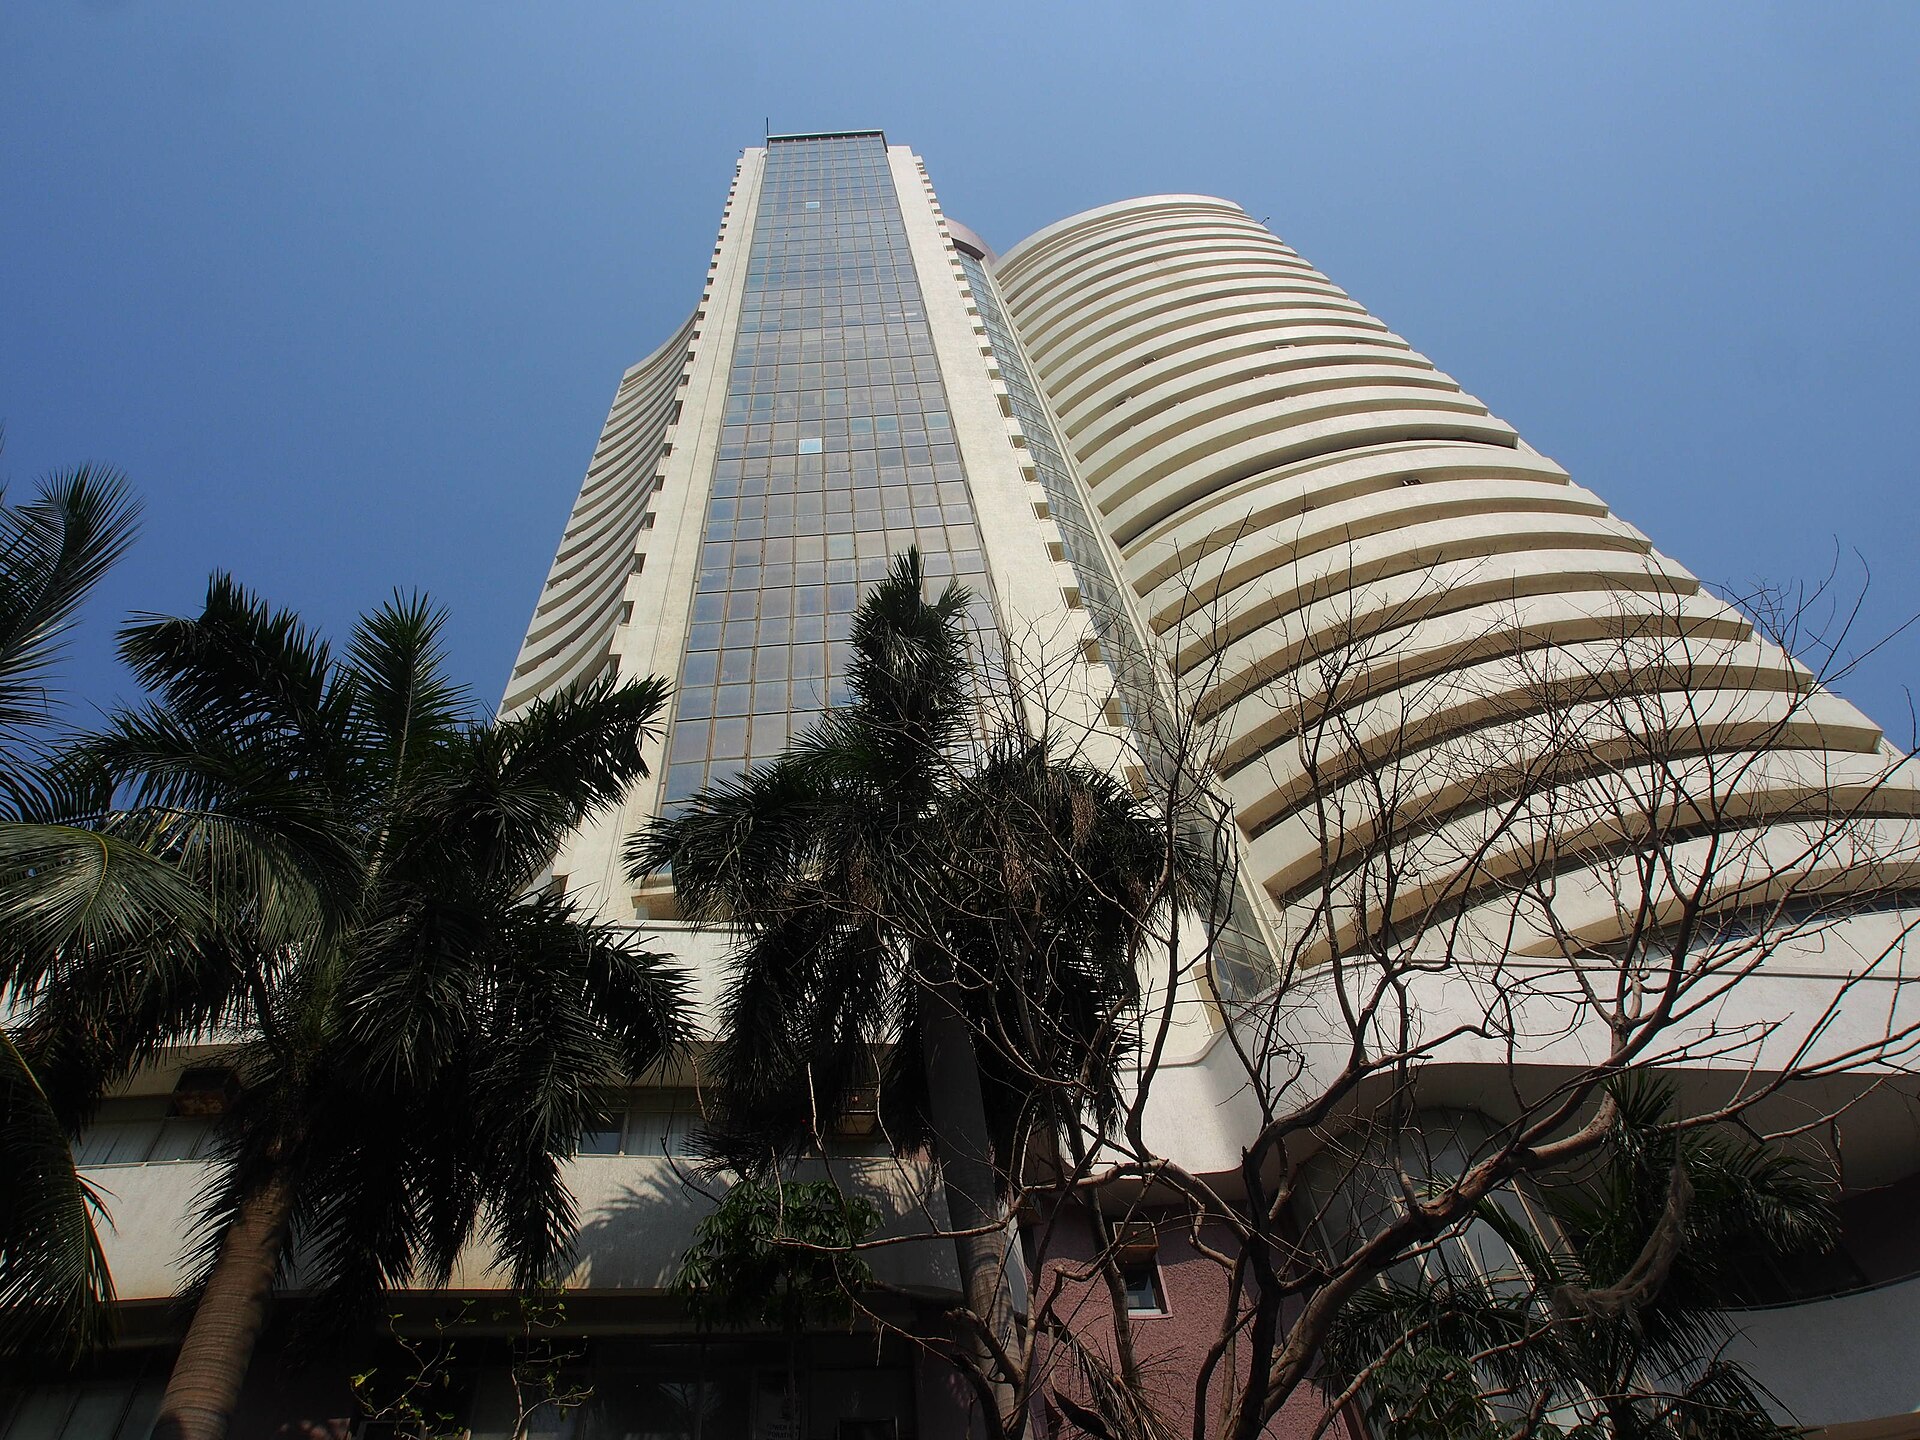



Every IPO season throws up the same question at some point: are new listings, as a group, actually doing well, or are we only remembering the handful that doubled on day one? The BSE IPO index is one of the few public yardsticks built to answer exactly that. It holds companies only for their first year after listing and then lets them go, so it is a running scorecard of the primary market rather than of the market as a whole.
This piece walks through how the index is built, how it differs from its newer cousin, the BSE Select IPO Index, and what it can and cannot tell you. The rules below come from two documents published by BSE Index Services Pvt. Ltd. (formerly Asia Index Pvt. Ltd.): the BSE Indices Methodology and the BSE Select IPO Index Methodology (October 2026). Index providers revise these documents from time to time, so treat the current PDF as the final word.
In this article
- What the BSE IPO Index Is Trying to Measure
- Who Gets In: The Entry Rules
- Who Gets Out: The One-Year Exit
- How the Weights Work, With a 20% Cap
- The SME Version Plays by Slightly Different Rules
- BSE Select IPO Index: A Longer, Stricter Filter
- How to Actually Use an IPO Index
- What the Index Will Not Tell You
- The Short Version
What the BSE IPO Index Is Trying to Measure
BSE files the IPO index under its “Strategy” family. The methodology describes it in one line: the index tracks the performance of stocks listed via initial public offerings over a one-year period from their listing date. That one-year window is the whole point. A broad index like the Sensex is dominated by large, long-listed companies, and a new listing barely moves it even when the IPO is huge. The IPO index flips that around. Only fresh listings are in it, and they all leave once their first year is up.
So when someone says “IPO stocks have had a rough six months”, this is the kind of index that can confirm or contradict it. It reflects how the recent crop of listings has traded after the euphoria of the issue, which is a different question from how many IPOs were oversubscribed.
Some basic facts from the methodology’s base-date table: the BSE IPO index was launched on 24 August 2009, with a base date of 3 May 2004 and a base value of 1,000. Its SME counterpart, the BSE SME IPO index, was launched on 14 December 2012 with a base date of 16 August 2012 and a base value of 100.
Who Gets In: The Entry Rules
The entry rules are short. Here is what the methodology lays down for the BSE IPO index:
- Only IPOs. Companies listed on BSE after completing their IPO are eligible. Follow-on public issues are not.
- A size floor. The company must have a float-adjusted market capitalisation of at least ₹100 crore, calculated at the issue price.
- Timing. A company that meets the size test is added on the third day of listing.
The size floor deserves a closer look because “float-adjusted” trips people up. Float adjustment counts only the shares that are realistically available for trading, not the promoter’s locked holding. BSE’s broader float rules sit in a separate float adjustment methodology, so the numbers below are a simplified illustration, not BSE’s exact calculation.
Worked example (illustrative). Say a small company lists with 2 crore shares in total after the issue, priced at ₹200. Its full market value at the issue price is 2 crore × ₹200 = ₹400 crore. If only 20% of the shares count as free float, the float-adjusted figure is ₹400 crore × 0.20 = ₹80 crore. That is below the ₹100 crore floor, so the stock would not enter the index even though it is, technically, a fresh IPO. Now take a bigger issuer: 50 crore shares at ₹300 gives ₹15,000 crore, and at a 25% float that is ₹3,750 crore, comfortably in.
The practical effect is that very small mainboard listings tend to drop out of the picture. That matters when you compare the index against your own experience. If most of your IPO applications went into tiny issues, the index is not really measuring your basket.
Who Gets Out: The One-Year Exit
Exit is just as mechanical. The methodology says a company is excluded at the open of the Monday following the third Friday of the month after it completes one year of listing. There is one safety valve. The index keeps at least 10 companies at all times, and if an exit would push the count below 10, the removal waits until a new company is added.
Think about what this does to the composition. In a hot year with lots of large listings, the index can be crowded with recent names. In a dry spell, exits pile up and only the minimum-count rule keeps older names in the basket for longer than a year. Two readings of the same index level a year apart may be describing two completely different sets of companies.
An IPO index is a rolling snapshot. The level today and the level a year ago may not share a single stock, so compare them with that in mind.
How the Weights Work, With a 20% Cap
The BSE IPO index is weighted by float-adjusted market capitalisation, with any single stock capped at 20%. The methodology says weights are updated at each monthly rebalancing, so between rebalances a strong performer can drift above the cap.
Why have a cap at all? Because one mega-IPO could otherwise swallow the index. Here is a simplified example of how a cap redistributes weight. The exact capping mathematics BSE uses is in its index mathematics document; this only shows the idea.
Worked example (illustrative). Imagine ten recent listings with these float-adjusted values, in ₹ crore:
| Stock | Float-adjusted value (₹ cr) | Uncapped weight | Weight after 20% cap |
|---|---|---|---|
| A | 9,000 | 42.86% | 20.00% |
| B | 3,000 | 14.29% | 20.00% |
| C | 2,500 | 11.90% | 16.67% |
| D | 2,000 | 9.52% | 13.33% |
| E | 1,500 | 7.14% | 10.00% |
| F | 1,000 | 4.76% | 6.67% |
| G | 800 | 3.81% | 5.33% |
| H | 700 | 3.33% | 4.67% |
| I | 300 | 1.43% | 2.00% |
| J | 200 | 0.95% | 1.33% |
| Total | 21,000 | 100% | 100% |
Uncapped, stock A would be 9,000 ÷ 21,000, or about 42.86% of the index. With the cap, A is held at 20%, and the remaining 80% is shared among B to J in proportion to their values, which add up to ₹12,000 crore. B gets 3,000 ÷ 12,000 × 80% = 20%, C gets 2,500 ÷ 12,000 × 80% = 16.67%, and so on down the table.
Look at what happened. A is more than four times B’s size but carries the same weight. A 10% move in A moves the capped index by about 2 percentage points, against roughly 4.3 points if it were uncapped. For anyone reading the index, the takeaway is simple: it leans less on the one blockbuster listing than a pure market-cap view would.
The SME Version Plays by Slightly Different Rules
The BSE SME IPO index covers companies listed on the BSE SME Platform after their IPO. The methodology sets out a few differences from the mainboard index:
- A company is added on the second day of listing, not the third.
- It is excluded at the open of the Monday after the third Friday of the month after it completes one year on the SME platform.
- If it migrates from the SME platform to the BSE mainboard, it is removed on the effective date of migration, even if that happens before the year is up.
- At least 10 companies are kept at all times, with the same delayed-exit rule.
- Constituents are weighted by float-adjusted market capitalisation. The SME section does not mention a ₹100 crore floor or a 20% cap.
That migration rule is a quiet but important detail. SME companies that do well enough to move up to the mainboard leave the SME index at that point. So the index does not hold on to its graduates, and that is worth keeping in mind if you use it to judge how SME IPOs as a whole have fared.
BSE Select IPO Index: A Longer, Stricter Filter
BSE now also runs a second, quite different product. The BSE Select IPO Index, per its own methodology, was launched on 18 November 2024, with a base date of 30 May 2014 and a base value of 1,000. It measures companies listed through IPOs and spin-offs or demergers, and it can hold them for much longer.
The key rules, from the October 2026 methodology:
- Quarterly review. It is rebalanced at the open of the Monday after the third Friday of March, June, September and December. The reference date is the close on the last trading day of February, May, August and November.
- Who is eligible. Each reconstitution draws from IPOs and spin-offs or demergers listed in the past one year from the reference date. Stocks need at least three months of listing history on BSE, and only common stocks qualify.
- Size and liquidity tests. A stock with average market capitalisation above the 200th stock in the BSE AllCap index is eligible for direct inclusion. One above the 500th stock by average market cap that also has annualised traded value above the 475th stock is eligible too.
- Exits. Existing members go if average market cap or annualised traded value falls below the 600th stock in the BSE AllCap, or once they have completed five years in the index.
- Count. The index should hold a minimum of 20 and a maximum of 100 stocks. If the count drops below 20, the five-year condition is relaxed.
- Weights. Float-adjusted market cap with a 5% cap per stock. If the count falls below 20 for any other reason, that cap is replaced with 10%.
- Fast track. A significantly sized IPO that ranks among the top 30 by average daily total market cap can be added early, with a minimum listing history of one month and five days’ notice to clients where possible.
When the count would cross 100, the methodology uses a points table to decide exits. A stock earns vintage points from 5 (less than one year in the index) down to 1 (less than five years), and market-cap points from 5 (top 20% of the index) down to 1 (bottom 20%). Ties are broken by excluding the stock with the lowest average market cap.
Worked example (illustrative). Stock P has been in the index for two and a half years, so it is in the “less than 3 years” band and gets 3 vintage points. It is in the top 20% by average market cap, so it gets 5 more, for 8 in total. Stock Q is barely six months in, so it gets 5 vintage points, but it sits in the bottom 20% by market cap, for 1 point and a total of 6. We read the table as favouring higher scores, so P has the stronger claim to stay despite being older.
The original IPO index asks how this year’s listings are doing. The Select IPO Index asks how the bigger, more liquid listings of recent years are doing, and for up to five years.
How to Actually Use an IPO Index
We find these indices most useful as context, not as trading signals. A few practical ways to use them:
- Check the mood behind the headlines. Subscription numbers tell you about demand at the issue. The IPO index tells you what happened after listing. If subscriptions are huge but the index is sliding, it can point to heavy selling after listing. Our piece on IPO flipping explains why that often happens.
- Mind the lock-in calendar. Large blocks of pre-IPO and anchor shares become free to sell at fixed points after listing, so it helps to know where those dates sit inside the first-year window the BSE IPO index covers. See our explainers on the IPO lock-in period and anchor investors.
- Compare like with like. Set the IPO index against a broad benchmark over the same period. If both fell, the problem may be the market, not IPOs. If only the IPO index fell, recent listings are underperforming on their own.
- Do not treat it as your return. The index enters on the third day of listing (second day for SME), not at the issue price, so any listing-day pop or drop is mostly missing from it. Your return on an allotment starts from the issue price.
What the Index Will Not Tell You
A few limits follow straight from the rules:
- Survivorship within the window. The one-year exit and the SME migration rule both move stocks out on a schedule. The index tells you about the current batch, not about how a given IPO cohort did over three or five years.
- Small issues are under-represented. The ₹100 crore float floor on the mainboard index keeps tiny listings out.
- Weight caps change the story. With a 20% cap (5% for the Select version), the index can look better or worse than the single giant IPO everyone is talking about.
- It is still market-cap weighted. A few large names can dominate even after capping, as the table above shows.
None of this makes the index less useful. It just means you have to know which question it answers. For the bigger picture on how to approach new issues, our pillar on IPO investing in India covers the basics, from reading the offer document to the allotment process.
The Short Version
The BSE IPO index is a one-year scorecard of mainboard listings: companies with at least ₹100 crore of float-adjusted value at the issue price come in on day three, are weighted by float-adjusted market cap with a 20% cap, and leave after a year, subject to a 10-stock minimum. The SME IPO index does the same for SME listings, with a day-two entry and removal on migration. The newer BSE Select IPO Index is a stricter, quarterly product that holds larger and more liquid IPOs and demergers for up to five years with a 5% cap. Use them to check how recent listings are really trading, and remember that none of them starts at your issue price.
Disclaimer: This article is for educational purposes only and is not investment advice. All companies and figures in the worked examples are illustrative, and the capping example is a simplified version of the idea, not BSE’s exact calculation. Index rules are summarised from the BSE Indices Methodology and the BSE Select IPO Index Methodology (October 2026) published by BSE Index Services Pvt. Ltd.; these can change, so check the latest documents. Please consult a SEBI-registered investment adviser before making any investment decision.

Leave a Reply
Join the conversation
Commenting is open to registered readers. Sign up with just your email — no password needed, and it takes under a minute.
Sign up to comment Log in