
Technical analysis is the study of price and volume to understand what buyers and sellers are doing and where the balance between them might shift next. This guide is written for traders and investors in Indian markets, using NSE trading hours and the instruments that retail participants actually use: cash equities, Nifty and Bank Nifty futures and options. It starts with the foundations (charts, support and resistance, trend) and works up to volume profile, order flow, and the Smart Money / ICT vocabulary that has become popular on Indian trading social media. Each section explains what a concept is, how to use it, and where it fails.
This guide is for education only. Dalal Street Blogs is not registered with SEBI. Every price example below is hypothetical and was made up to illustrate a concept. None of them is a recommendation.
Table of Contents
- What Technical Analysis Is (and Is Not)
- Chart Types and Timeframes
- Support and Resistance
- Trendlines and Market Structure (HH/HL, BOS, CHoCH)
- Candlestick Patterns
- Chart Patterns
- Volume Analysis, VWAP and Volume Profile
- Indicators: RSI, MACD, Bollinger Bands, Moving Averages, ATR
- Supply and Demand Zones
- Order Flow Basics for NSE Retail Traders
- Smart Money and ICT Concepts
- Multi-Timeframe Analysis
- Putting It Together: A Sample Trade Plan
- Risk Management
- Common Mistakes
- FAQs
- SEBI Disclaimer
What Technical Analysis Is (and Is Not)
Technical analysis rests on three working assumptions. The first is that price already reflects most publicly known information. The second is that prices tend to move in trends that persist for longer than random chance would suggest. The third is that crowd behaviour (fear, greed, anchoring to round numbers and recent highs) repeats often enough to leave recognisable footprints on a chart. None of these is a law. They are tendencies, which is why every technical method works in probabilities and needs a stop loss.
Technical analysis is not a way to predict the future with certainty, and it is not a substitute for knowing what you own. Before a stock’s quarterly numbers, the chart can be overruled in a single gap. That’s why it is worth reading our guide on how to analyse quarterly results alongside this one. Most durable traders use the chart for timing and risk and use fundamentals and news for context.
Chart Types and Timeframes
Line, bar and candlestick charts
A line chart joins closing prices. It is the cleanest way to see the overall trend and the most important closing levels, and it is useful on weekly and monthly charts of the Nifty 50. A bar (OHLC) chart shows the open, high, low and close of each period. A candlestick chart shows the same four values, but colours the body between open and close, so you can see at a glance who won the session. Most Indian broker platforms default to candlesticks, and this guide uses them throughout.
Heikin-Ashi, Renko and other derived charts
Heikin-Ashi candles average price to smooth out noise. They make trends easier to see but hide real open and close prices, so never place stop losses using Heikin-Ashi values. Renko and point-and-figure charts ignore time and print a new brick only when price moves a fixed amount. They are good for spotting clean breakouts but poor for anything time-based, such as intraday sessions.
Choosing timeframes
Your timeframe should match your holding period:
- Positional investors (weeks to months): monthly and weekly charts for trend, daily for entries.
- Swing traders (days to a few weeks): weekly for context, daily for setups, 60-minute or 75-minute for timing. A 75-minute chart divides the 9:15 AM to 3:30 PM NSE session into five equal candles, which many Indian traders prefer over 60 minutes.
- Intraday traders: daily and 75-minute for context, 15-minute for structure, 5-minute or 3-minute for execution.
A useful rule of thumb is a factor of four to six between timeframes, for example daily → 75-min → 15-min. Lower timeframes create more signals and more noise. They also add costs: brokerage, STT and slippage add up quickly when you trade many small moves.
Support and Resistance
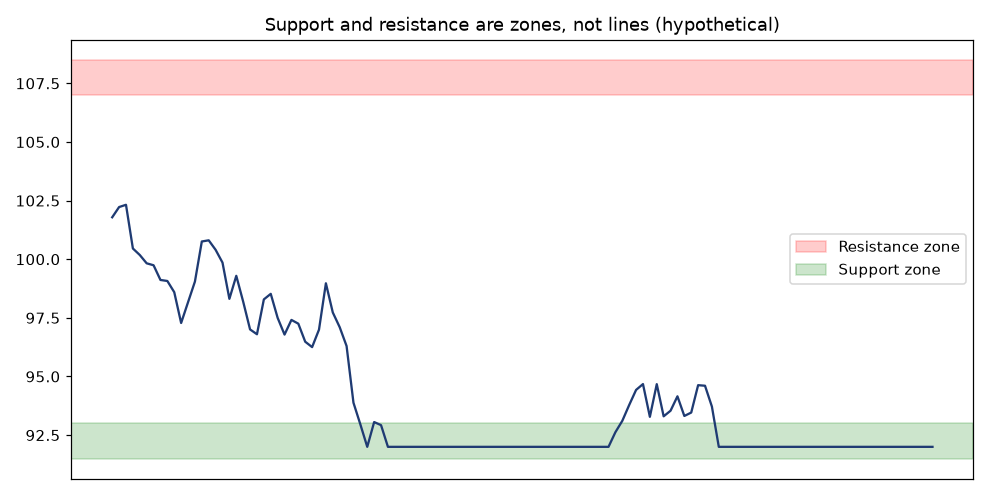
Support is a price area where buying has previously been strong enough to stop a decline. Resistance is an area where selling has stopped an advance. They exist because traders remember prices. People who bought at ₹500 and watched the stock fall to ₹420 are often happy to sell at break-even when it returns to ₹500, which creates supply there.
How to draw them well
- Draw zones, not lines. Use the area between the candle bodies and wicks of the reaction points. A zone ₹5–10 wide on a ₹500 stock is normal.
- Prefer obvious levels: prior swing highs and lows, the previous day’s high and low, the 52-week high, gap edges, and round numbers. On the Nifty, levels such as 22,000 or 22,500 attract options open interest, which tends to reinforce them.
- More touches is not always stronger. Each test absorbs orders resting at that level. A level hit for the fourth time in a week is often closer to breaking than holding.
- Role reversal: once resistance is broken decisively, it often acts as support on a retest, and the reverse applies to broken support.
Worked example (hypothetical)
Suppose stock ABC has turned down three times near ₹780–790 over four months. It then closes at ₹806 on volume about twice its 20-day average. A breakout trader might wait for a pullback into ₹785–795 (old resistance acting as new support), buy there, and place a stop below ₹770, under the zone and the most recent swing low. If price closes back below ₹780, the breakout has failed. Failed breakouts are information too: trapped buyers often fuel a sharp drop.
Trendlines and Market Structure (HH/HL, BOS, CHoCH)
Trendlines and channels
An uptrend line joins two or more rising swing lows. A downtrend line joins falling swing highs. A parallel line through the opposite swings creates a channel. Trendlines are subjective, since two traders rarely draw the same one, so treat them as a guide to trend health rather than exact triggers. A steep trendline (more than about 45° on a sensibly scaled chart) is rarely sustainable. When it breaks, the trend often just slows down rather than reversing.
Market structure
Market structure describes a trend through its swing points, with no lines needed:
- Uptrend: higher highs (HH) and higher lows (HL).
- Downtrend: lower highs (LH) and lower lows (LL).
- Range: swings that fail to make meaningful new highs or lows.
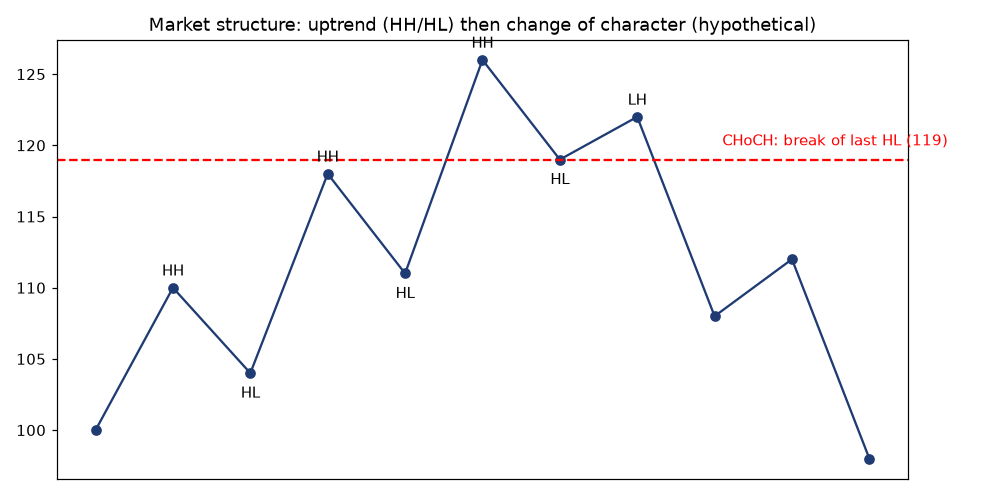
A Break of Structure (BOS) happens when price breaks a swing point in the direction of the trend, for example a new higher high in an uptrend. It confirms that the trend is continuing. A Change of Character (CHoCH) is the first break against the trend, for example price closing below the most recent higher low in an uptrend. A CHoCH is an early warning that the trend may be ending. It isn’t proof. It often leads to a range before any real reversal.
Worked example (hypothetical)
Suppose a stock prints swing lows at ₹104, ₹111 and ₹119 and swing highs at ₹110, ₹118 and ₹126. That is a clean uptrend. It then rallies only to ₹122 (a lower high) and closes at ₹117, below the ₹119 higher low. That close is a CHoCH. A swing trader holding a long position might tighten the stop or book profits. An aggressive trader might look for a short only after a lower high forms on the next bounce, not on the break itself.
Always define swings on one chosen timeframe. A CHoCH on the 5-minute chart can be a normal pullback inside a daily uptrend. This is the core idea behind multi-timeframe analysis.
Candlestick Patterns
A candle tells you who controlled a period. A long body with small wicks shows conviction. Long wicks show rejection. Patterns matter only at a meaningful location, such as support, resistance or the edge of a range. The same hammer in the middle of nowhere means little.
Single-candle patterns
- Doji: the open and close are nearly equal, showing indecision. It is significant after a long trend into a key level.
- Hammer / hanging man: a small body near the top and a lower wick at least twice the body. A hammer at support shows buyers rejecting lower prices. The same shape after a rally (a hanging man) is a weaker warning.
- Shooting star / inverted hammer: a long upper wick. At resistance, it shows sellers rejecting higher prices.
- Marubozu: a full-body candle with almost no wicks, showing strong one-sided control.
Multi-candle patterns
- Bullish / bearish engulfing: the second body completely covers the first, a clear shift in control.
- Morning star / evening star: a three-candle reversal, made up of a trend candle, a small indecision candle, and a strong counter candle that closes deep into the first.
- Inside bar: the whole range sits within the prior candle, showing contraction. A break of the mother bar’s high or low often starts the next move.
- Piercing line / dark cloud cover: partial engulfing patterns that close beyond the midpoint of the prior candle.
Making candles useful
Wait for the candle to close. A hammer at 2:45 PM can turn into a bearish marubozu by 3:30 PM. Use the pattern’s extreme for your stop: below a hammer’s low, or above a shooting star’s high. Confirm it with volume, since a reversal candle on heavy volume carries more weight. Treat Indian opening gaps carefully. On daily charts, gaps often create engulfing-looking candles that come from overnight global cues rather than a real shift in local supply and demand.
Chart Patterns
Continuation patterns
- Flags and pennants: a sharp move (the pole) followed by a short, tight consolidation against it. A common target estimate is the pole’s length projected from the breakout.
- Ascending / descending triangles: a flat top with rising lows (usually bullish) or a flat bottom with falling highs (usually bearish).
- Rectangles: horizontal ranges, where the breakout direction tends to follow the prior trend.
- Cup and handle: a rounded base followed by a small pullback below the rim. It is common in Indian mid-caps before multi-month advances.
Reversal patterns
- Double top / double bottom: two failed attempts at a level, confirmed only when the neckline (the swing between them) breaks.
- Head and shoulders / inverse: three peaks with the middle one highest. A neckline break plus a retest is the classic entry.
- Rising / falling wedges: converging trendlines with momentum fading. A rising wedge is usually bearish, and a falling wedge usually bullish.
Worked example (hypothetical)
Suppose stock XYZ forms a double bottom at ₹240 and ₹242, with a neckline at ₹268. The pattern height is about ₹28, so a measured-move target after a neckline break is about ₹296. A trader buying on a close above ₹270 with a stop at ₹252 risks ₹18 to target ₹26, a reward-to-risk of about 1.4:1. That is marginal. A better entry would be a retest of ₹268–270 with a stop at ₹258 (risk ₹12, reward ₹26, about 2.2:1). Pattern targets are rough estimates, not promises. Many patterns fail, so the stop matters more than the target.
Volume Analysis, VWAP and Volume Profile
Reading volume
Volume measures participation. Some useful rules of thumb:
- A breakout on volume above about 1.5× the 20-day average is more trustworthy than one on thin volume.
- In a healthy uptrend, volume rises on up-moves and shrinks on pullbacks.
- A huge-volume candle with little price progress (often called churn) at the end of a long move suggests that supply is being absorbed. That can mark distribution near tops or accumulation near bottoms.
- On NSE, check delivery percentage in the exchange’s bhavcopy or security-wise delivery data. A rally with rising delivery volume suggests real buying. A rally driven by intraday turnover is more fragile.
VWAP (Volume-Weighted Average Price)
VWAP is the average price of every share traded in the session, weighted by volume. It resets at 9:15 AM IST each day. Institutions often measure their execution against VWAP, so it acts as an intraday “fair value” line:
- Price holding above a rising VWAP suggests buyers are in control. Pullbacks to VWAP are common long entries in trends.
- Price below a falling VWAP favours sellers.
- Repeated crossing of a flat VWAP signals a range day, so reduce trade frequency.
Anchored VWAP starts the calculation from a chosen event, such as a results day, a budget day or a major swing low. It shows the average cost of everyone who traded since that event, which often acts as support or resistance for days or weeks.
Volume profile
Volume profile plots volume by price level rather than by time. Its key parts are:
- POC (Point of Control): the price with the most traded volume, a magnet for price.
- Value Area (VAH/VAL): the range containing about 70% of volume.
- HVNs (high-volume nodes): areas of acceptance, where price tends to slow down.
- LVNs (low-volume nodes): areas of rejection, where price tends to move through quickly.
Worked example (hypothetical): suppose yesterday’s Nifty futures profile had a POC at 22,410, a VAH at 22,460 and a VAL at 22,350. If today opens at 22,480, above value, and fails to hold back above 22,460 in the first hour, a common read is a rotation back towards the 22,410 POC. If it holds above 22,460 and the opening range breaks higher, the market is accepting higher prices.
Indicators: RSI, MACD, Bollinger Bands, Moving Averages, ATR
Indicators are calculations on price and volume, so they lag price by design. Use one or two that answer different questions (trend, momentum, volatility) instead of five that all say the same thing.
Moving averages
The simple moving average (SMA) weights all periods equally. The exponential moving average (EMA) gives more weight to recent prices. Common choices in India are the 20 EMA for short-term trend, the 50 DMA for the intermediate trend, and the 200 DMA, which many institutional and media commentators use as the dividing line between bull and bear. A golden cross (50 above 200) and a death cross (50 below 200) are slow, late signals. They are more useful for context than for timing entries. In trends, the 20 EMA often works as dynamic support. In ranges, moving averages flatten and whipsaw.
RSI (Relative Strength Index)
RSI (usually 14 periods) measures the speed of recent gains against losses on a scale of 0–100. Readings above 70 are called overbought and below 30 oversold. In strong trends, though, RSI can stay at 70+ for weeks. Better uses include:
- Range shift: in uptrends, RSI tends to hold the 40–50 area on pullbacks. In downtrends it tends to cap at 50–60.
- Divergence: price makes a higher high while RSI makes a lower high, a sign of weakening momentum. It needs a structure break to act on.
For a deeper walk-through, see How to Read RSI on Nifty Stocks.
MACD
MACD is the difference between the 12 EMA and the 26 EMA. Its signal line is a 9-period EMA of MACD, and the histogram shows the gap between the two. A MACD line crossing above the signal line indicates improving momentum, and crosses above zero indicate a trend change. Crossovers whipsaw in ranges. The histogram shrinking while price keeps pushing is an early sign of momentum fading.
Bollinger Bands
Bollinger Bands are a 20-period SMA with bands two standard deviations above and below it. A squeeze, where the bands are at their narrowest in months, signals low volatility that often comes before a big move, though not its direction. In strong trends, price can “walk the band”, so a touch of the upper band is not automatically a sell. In ranges, moves outside the bands that quickly close back inside often reverse.
ATR (Average True Range)
ATR (usually 14) measures average volatility in price terms, including gaps. It is the most practical indicator for risk:
- Stop placement: for example, 1.5× ATR beyond your invalidation level, so normal noise doesn’t stop you out.
- Position sizing: a higher ATR means more volatility, so you take a smaller quantity for the same rupee risk.
- Target sanity check: expecting a ₹40 intraday move from a stock with a ₹12 daily ATR is unrealistic.
Worked example (hypothetical): suppose a stock trades at ₹1,200 with a daily ATR of ₹30. A swing long with a structure low at ₹1,170 might place the stop at ₹1,170 − (0.5 × 30) = ₹1,155. That puts the risk at ₹45 per share.
Supply and Demand Zones
Supply and demand trading looks for the origin of strong moves. When price leaves an area explosively, the theory is that unfilled orders were left behind, and price may react when it returns there.
- Demand zone: a base (one to a few small candles) followed by a strong rally. It appears as Drop-Base-Rally (a reversal) or Rally-Base-Rally (a continuation).
- Supply zone: a base followed by a strong decline: Rally-Base-Drop or Drop-Base-Drop.
Signs of a higher-quality zone:
- A strong, fast departure with large candles and possibly a gap.
- A short time spent in the base.
- The zone is fresh and hasn’t been retested yet.
- It sits in the direction of the higher-timeframe trend.
- There is good reward-to-risk to the next opposing zone.
Supply and demand zones overlap heavily with support and resistance and with the Smart Money “order block” idea below. They are largely different names for the same observation: the place where price last balanced before an imbalance.
Order Flow Basics for NSE Retail Traders
Order flow analysis studies the actual transactions: who hit the bid, who lifted the offer, and how much size is resting at each price. Here is what retail traders in India can and cannot realistically see.
What you can see
- Market depth (top 5 or 20 levels): most Indian brokers show the best five bid and ask levels. Some show 20-level depth. It is useful for judging liquidity and spread, especially in mid-caps and options strikes.
- Time and sales / tick data: available on some platforms, so you can see traded prices and sizes.
- Delta and footprint charts: some third-party platforms estimate buy versus sell volume per candle from tick data. These are useful but are estimates, because trade direction is inferred.
- Open interest (OI) in F&O: changes in OI together with price show whether futures positions are being built or unwound (long build-up, short build-up, short covering, long unwinding). Options OI by strike shows where writers have concentrated.
- End-of-day data: delivery percentage, bulk and block deals, and FII/DII cash flows. Our Stock Market Today page tracks the daily FII/DII numbers.
What you cannot see
- The full order book. Depth shows only a few levels.
- Iceberg or hidden orders, algorithmic intent, or who is behind a trade.
- Most institutional execution, which is spread over hours using VWAP/TWAP algorithms.
Depth can change in milliseconds, and large visible orders can disappear (spoofing is illegal but does occur). Treat depth as a liquidity gauge rather than a signal. For most retail traders, VWAP, volume profile, OI changes and delivery data give most of the useful order-flow information at a fraction of the complexity.
Smart Money and ICT Concepts
“Smart Money Concepts” (SMC) and the ICT (Inner Circle Trader) framework are a vocabulary for describing how large participants might leave footprints: pockets of resting liquidity, inefficient moves and rebalancing. Many of the ideas repackage classic supply and demand and Wyckoff concepts. Some of the claims made online, such as banks “hunting” your stop personally or a guaranteed precision entry, are not supported by evidence. Used as a structured way to read price, the concepts below can still be helpful.
Liquidity and liquidity sweeps
Stop losses and breakout orders cluster in obvious places: above equal highs, below equal lows, and around the previous day’s high or low and round numbers. A liquidity sweep (or stop hunt) happens when price pokes through such a level, triggers those orders, and then reverses back inside. In practice, a sweep is a failed breakout seen from the other side. The signal comes from the reclaim: a candle closing back inside the range.
Order blocks
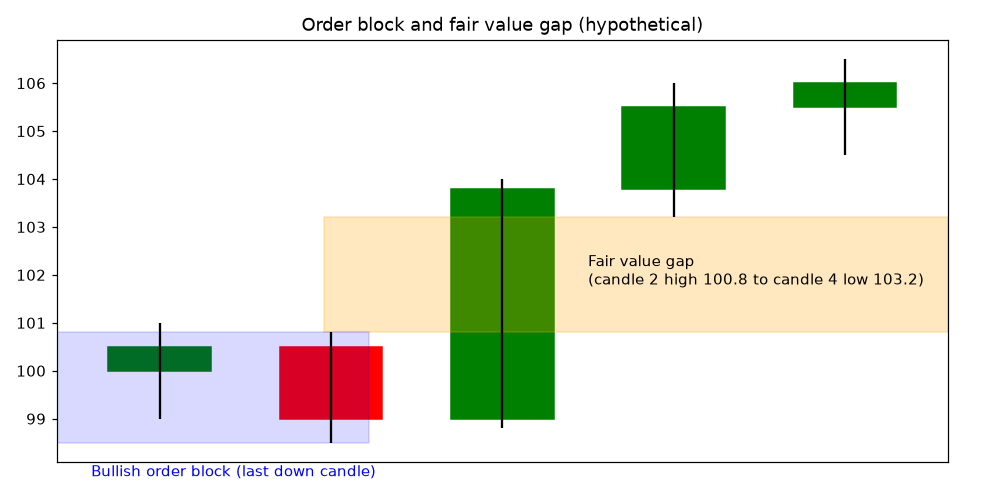
A bullish order block is the last down candle before a strong up move that breaks structure. A bearish order block is the last up candle before a strong down move. The idea is that institutions built positions there and may defend the area on a return. The rules most practitioners use are that the move away must break structure (a BOS) and that unretested blocks are preferred.
Breaker blocks
A breaker is an order block that failed. Price traded through it, breaking structure the other way. The failed block then often flips role. A broken bullish order block can act as resistance on a retest, much like support turning into resistance.
Fair value gaps (FVGs)
An FVG is a three-candle imbalance in which the first candle’s high and the third candle’s low don’t overlap (for a bullish move). That leaves a price range that only one side traded through. Price often retraces partly into FVGs before continuing. On NSE daily charts, overnight gaps are the extreme version of this. Not every FVG fills, and in strong trends many are skipped.
Premium and discount
Take a dealing range (from a swing low to a swing high) and mark its 50% level, the equilibrium. Above 50% is the premium zone and below it is the discount zone. The guideline is to look for longs in discount within an uptrend and shorts in premium within a downtrend. This is the old advice to buy pullbacks rather than chase strength, written in new terms. The 62–79% retracement area (the “optimal trade entry” in ICT language) overlaps with classic Fibonacci levels.
Kill zones adapted to IST and NSE hours
ICT kill zones were designed around London and New York forex sessions, which don’t map directly onto Indian equities. For NSE cash and F&O (9:15 AM to 3:30 PM IST), a practical adaptation looks like this:
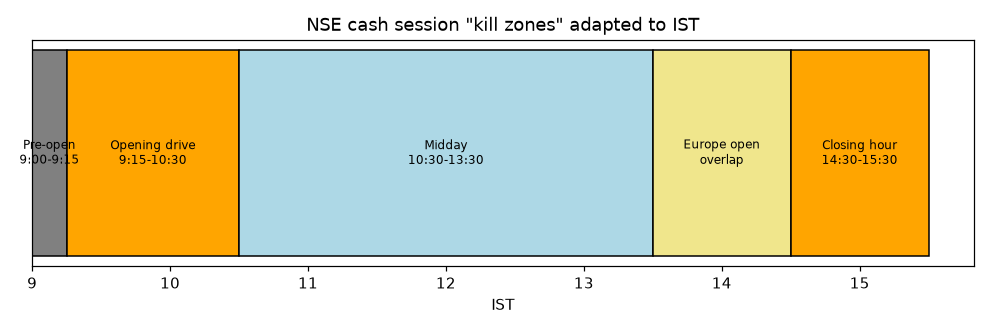
- 9:00–9:15 AM (pre-open): price discovery. Watch the indicated open against the previous close and the previous day’s high and low.
- 9:15–10:30 AM (opening drive): the highest volume and volatility. The first 15–30 minutes often sweep the previous day’s high or low or the opening-range extremes. Many of the day’s highs or lows are set here.
- 10:30 AM–1:30 PM (midday): often slower and range-bound, with lower-quality signals and more whipsaws.
- About 1:30–2:30 PM (Europe open overlap): European markets open around 12:30–1:30 PM IST depending on daylight saving. Fresh flows can start a new leg.
- 2:30–3:30 PM (closing hour): institutional position adjustment, and on expiry days option-driven moves. Volume rises again. NSE’s closing price has been based on 3:00–3:30 PM trades, but a Closing Auction Session is being phased in for F&O stocks (NSE circular NSE/CMTR/73362).
US data releases and the US open (about 7:00–8:00 PM IST) fall after NSE closes. They mainly affect the next day’s gap, GIFT Nifty, and MCX commodities.
Worked example (hypothetical)
Suppose Nifty futures closed yesterday at 22,420, with a previous-day low of 22,380. Today they open at 22,400 and drop to 22,360 by 9:25 AM, sweeping yesterday’s low. A 5-minute candle then closes back above 22,380 and the 5-minute structure breaks above the 22,395 swing high (a CHoCH), leaving a small FVG at 22,385–22,392. A rule-based plan would enter on a retrace into that FVG, place the stop below the 22,360 sweep low (about 30 points of risk), and target yesterday’s POC at 22,450 (about 60 points, 2:1). If price closes back below 22,360, the idea is wrong and the trade is closed.
Multi-Timeframe Analysis
Most good setups line up across timeframes. A simple three-layer process works well:
- Higher timeframe (HTF), for direction. Weekly/daily for swing trades, daily/75-min for intraday. Is the structure HH/HL or LH/LL? Is price in premium or discount? Where are the major supply and demand zones?
- Middle timeframe, for the setup. Wait for price to reach an HTF zone, then look for a pattern, such as a pullback to the 20 EMA, a flag, or an order block or FVG.
- Lower timeframe (LTF), for the trigger. Use a CHoCH or engulfing candle on the lower timeframe to enter with a tight, logical stop.
The main rule is that the higher timeframe sets the bias and the lower timeframe gives the timing. Trading against the HTF trend isn’t forbidden, but it needs smaller size and quicker targets.
Putting It Together: A Sample Trade Plan
The plan below is entirely hypothetical. It shows how the concepts combine and is not a recommendation.
| Step | Hypothetical stock “DEF Ltd” |
|---|---|
| Weekly context | Uptrend (HH/HL) above a rising 50-week average; recent breakout from a ₹900–950 base. |
| Daily setup | Pulls back from ₹1,010 to ₹955–965, which is the old resistance (role reversal), a fresh demand zone, and discount of the ₹900–1,010 leg. RSI holds at 45. |
| Trigger | A bullish engulfing candle on the 75-min chart at ₹962, closing above VWAP on 1.6× average volume. |
| Entry | ₹965 |
| Stop loss | ₹938: below the zone and the swing low, about 1× daily ATR (₹27). Risk ₹27/share. |
| Targets | T1 ₹1,010 (prior high, about 1.7R): book half and move the stop to break-even. T2 ₹1,050 measured move (about 3.1R). |
| Position size | Capital ₹5,00,000 × 1% risk = ₹5,000 ÷ ₹27 ≈ 185 shares (about ₹1.79 lakh exposure). |
| Invalidation | Daily close below ₹938, or results due before T1 (avoid holding through the event or cut the size). |
| Review | Log entry, exit, reason, screenshot and emotional state in a trading journal. |
Risk Management
Analysis decides where to trade, and risk management decides whether you survive the inevitable losing streaks. The essentials are:
- Fixed fractional risk: risk 0.5–2% of trading capital per trade. With 1% risk, ten losses in a row cost about 10%, which is painful but recoverable.
- Position size from the stop, not the other way round: quantity = rupee risk ÷ (entry − stop).
- Reward-to-risk and win rate together: at 2:1, you break even, before costs, at a win rate of about 34%.
- Daily and weekly loss limits: for example, stop trading for the day after −2R.
- Leverage and F&O caution: SEBI’s own studies have found that a large majority of individual F&O traders lose money (SEBI’s September 2024 study found that about 93% of individual equity F&O traders made net losses between FY22 and FY24). Learn on cash or small sizes first. Options buyers face time decay, and sellers face theoretically large losses.
- Event risk: results, RBI policy, the Union Budget and global events can gap price past your stop.
- Costs: include brokerage, STT, exchange charges, GST, stamp duty and slippage in your expectancy.
Our detailed guides cover this in depth: Risk Management in Trading and Position Sizing and Risk Management. If you trade derivatives, read Options Trading for Beginners in India first.
Common Mistakes
- Indicator overload: stacking RSI, MACD, stochastics and CCI, which all measure momentum, creates false confidence.
- Ignoring the higher timeframe: shorting a 5-minute “CHoCH” in the middle of a strong daily uptrend.
- Acting before the candle closes: patterns change shape until the close.
- Treating levels as exact lines: stops placed right at obvious levels get swept.
- Moving or removing stop losses: the most common way small losses become large ones.
- Over-trading lower timeframes: costs and noise eat the edge.
- Curve-fitting: tweaking settings until the past looks perfect. Test rules on data you didn’t use to design them.
- Ignoring news and events: results, corporate actions and policy announcements override charts.
- Revenge trading after losses and increasing size to “win it back”.
- Following paid tips or unregistered “advisers” on Telegram or WhatsApp. Check SEBI registration on the SEBI website.
- No journal: without records, you can’t tell skill from luck.
FAQs
Does technical analysis really work in the Indian stock market?
It can help with timing entries and exits, managing risk, and reading sentiment, but no method is consistently right. Its value comes from repeatable rules applied with strict risk control. No chart pattern predicts the future with certainty.
Which timeframe is best for beginners?
Daily charts. They filter out intraday noise, give you time to think, and reduce costs. Add the weekly chart for context and a 75-minute chart for timing once you are comfortable.
What is the best indicator?
No single indicator is best. A simple combination of a trend tool (20/50/200 moving averages), a momentum tool (RSI) and a volatility tool for stops and sizing (ATR) covers most needs.
Are Smart Money / ICT concepts better than classic TA?
They are mostly a different vocabulary for liquidity, supply and demand, and imbalance. They help some traders structure their thinking. They aren’t a secret edge and still need testing and risk management.
Can I see institutional orders on NSE?
Not directly. Retail traders see limited market depth. Indirect clues include VWAP behaviour, volume spikes, delivery percentage, OI changes, bulk and block deals, and FII/DII flow data.
How much should I risk per trade?
Many educators suggest 0.5–2% of trading capital per trade. Beginners should stay at the low end until they have a tested process.
Should I use technical analysis for long-term investing?
Long-term investors mainly rely on business fundamentals, but weekly and monthly charts can help avoid buying into obvious downtrends and help with staggered entries. See our guides on quarterly results analysis and IPO investing.
SEBI Disclaimer
This article is for educational and informational purposes only and is not investment advice or a recommendation to buy, sell or hold any security. Dalal Street Blogs and its authors are not registered with SEBI as Investment Advisers or Research Analysts. All examples, stock names and price levels in this guide are hypothetical. There are no guaranteed returns. Investments in the securities market are subject to market risks, and trading in derivatives carries a high risk of loss. Past performance is not indicative of future results. Authors may hold positions in securities discussed on this site, and any such holding will be disclosed in the relevant article. Please consult a SEBI-registered investment adviser before making investment decisions. Read our full Disclaimer.