
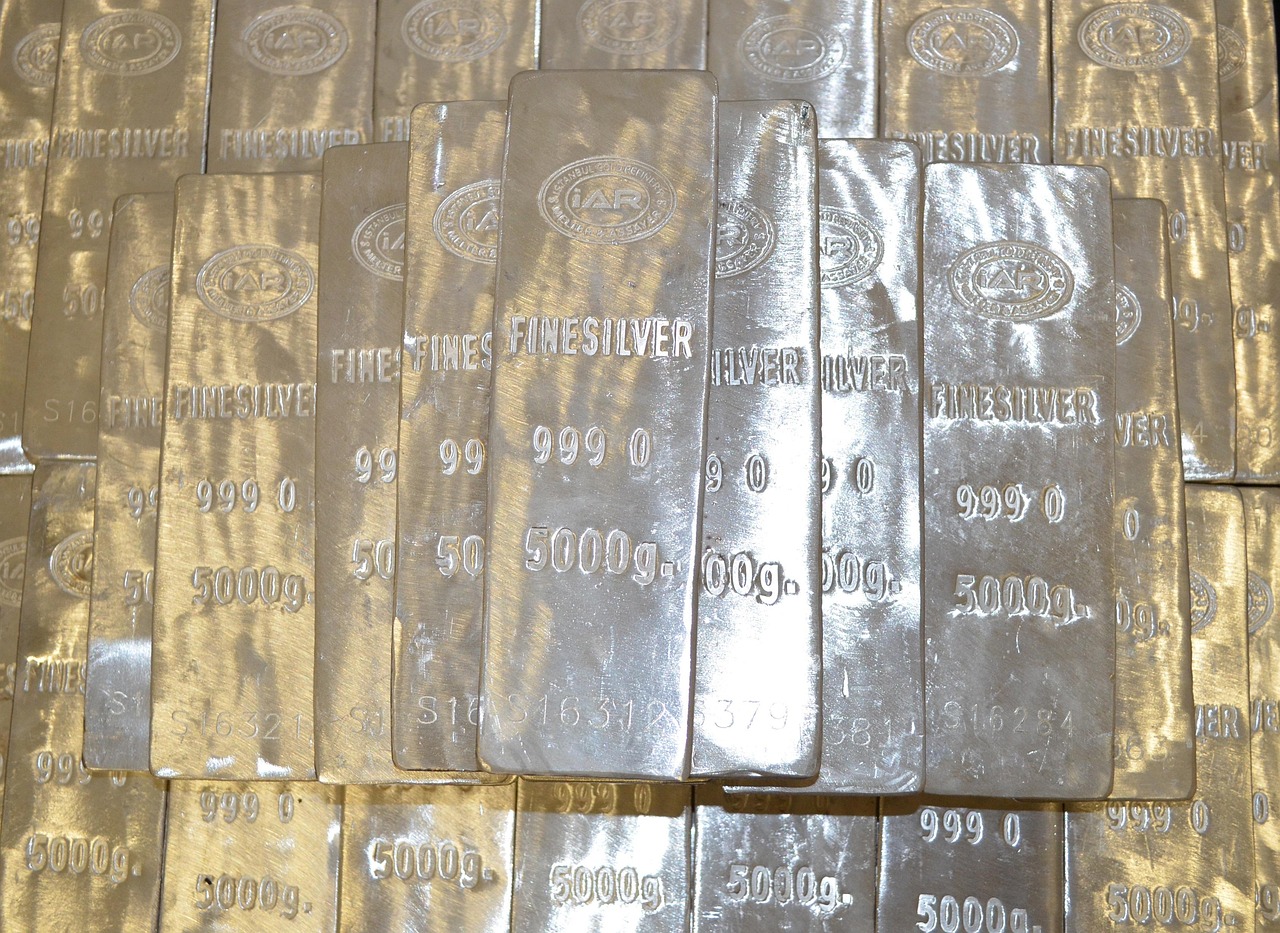



A silver ETF in India lets you own silver the way you own a share: you buy units on the exchange, they sit in your demat account, and nobody has to worry about where a heavy bar is kept or whether it is pure. That convenience is real. But the unit price does not move rupee for rupee with the silver you see quoted on the news, and the small gaps between the two are where most first-time buyers get surprised.
This guide walks through what these funds hold, how a unit is priced, what it costs to hold one, and a few worked examples with round, made-up numbers so the mechanics are easy to follow. Everything regulatory here comes from SEBI documents, which we link as we go.
In this article
- Why silver ETFs came to India so late
- What sits inside the fund
- How one unit relates to a gram of silver
- Pricing the bars: from LBMA to Indian exchanges
- Market price, NAV and the premium trap
- Tracking error, tracking difference and the 2% line
- What you pay to hold it
- How fund houses create units, using their own example
- Risks the offer document wants you to read
- Silver ETF versus gold ETF
- A short checklist before you buy
Why silver ETFs came to India so late
For years the only commodity a mutual fund could buy was gold, and only through gold ETFs. A SEBI board memorandum from 2021 on introducing silver ETFs says exactly that, and then lists why the industry wanted a silver version. AMFI, some fund houses, MCX and the India Bullion and Jewellers Association had all pushed for it.
The memo quotes MCX data on how India used silver in 2020. Total consumption was around 2,902 metric tonnes. Of that, industrial demand was around 832 tonnes, jewellery and silverware about 1,801 tonnes, and investment in physical silver roughly 269 tonnes. So investment was the smallest slice by a distance, and the memo gives a practical reason: silver is far cheaper than gold per gram, which makes it bulky to hold in size. It also tarnishes, and the memo notes that the secondary market for physical silver often has wide spreads between buying and selling prices.
Anyone who has tried to sell a few kilos of silver articles back to a local jeweller will recognise that last point. An exchange-traded unit fixes much of it. SEBI then issued its norms for silver ETFs and gold ETFs by a circular dated November 24, 2021.
What sits inside the fund
The board paper set out what a silver ETF is allowed to own, and the rules are tight:
- Physical bars. Only 30 kg bars of 999 parts per thousand fineness (99.9% pure) that meet London Bullion Market Association (LBMA) Good Delivery standards.
- Silver derivatives, capped. Exchange-traded commodity derivatives on silver count as silver-related instruments, but exposure is capped at 10% of the fund’s NAV because rolling futures every month costs more. The cap does not apply if the fund plans to take delivery of the silver rather than roll over.
- At least 95% in silver. Silver and silver-related instruments make up a minimum of 95% of net assets, with cash and equivalents at a maximum of 5%.
- A registered custodian. The fund has to appoint a SEBI-registered custodian to keep the metal safe.
So when you buy a unit, you are buying a slice of real bars sitting in a vault, plus a small sliver of cash and possibly a little in futures. It is not a promise from a bank or a paper claim on someone’s balance sheet.
How one unit relates to a gram of silver
Each fund decides its own unit size. Take the Axis Silver ETF scheme information document (the December 2024 version filed with SEBI) as a live example. It says one creation unit is 30,000 units, and each unit is approximately equal to one gram of silver. Thirty thousand grams is 30 kg, which lines up neatly with the size of one Good Delivery bar.
On the exchange, that same document says there is no minimum investment and units trade in lots of one. In practice, then, you can start with a single unit. Other funds pick different unit sizes, so the unit price of one silver ETF is not directly comparable with another’s. Compare returns and costs, not the sticker price per unit.
A silver ETF unit is a claim on real bars in a vault. The price you pay on the screen, though, is set by buyers and sellers, and it can drift away from what those bars are worth.
Pricing the bars: from LBMA to Indian exchanges
Every business day the fund has to put a value on its silver. That value, divided by units outstanding, is the NAV.
Until recently the starting point was London. The Axis document lays out the old method: take the LBMA AM fixing price in US dollars per ounce, convert ounces to kilograms at 999 fineness, convert dollars to rupees, then add customs duty and other levies. SEBI’s own circular of February 26, 2026 describes the same approach for both gold and silver ETFs, including adding transport costs and a notional premium or discount to reach a domestic price.
That circular changed the method. With effect from April 1, 2026, mutual funds value physical gold and silver using the polled spot prices published by recognised stock exchanges, the same prices used to settle physically delivered gold and silver derivatives contracts. SEBI’s reasoning was that exchange prices reflect domestic conditions and make valuation uniform across fund houses. AMFI was asked to frame a common policy with SEBI.
Why should a small investor care? Because older offer documents, including the 2024 Axis document we quote here, still describe the LBMA method and an LBMA-based benchmark. If you read one, check the fund house’s latest notices for how valuation and benchmarks work today.
Market price, NAV and the premium trap
There are two prices for any silver ETF, and confusing them is the most common mistake we see.
The NAV is what the fund’s silver is worth per unit at the end of the day. The market price is whatever the last buyer paid on the exchange. To keep the two close, the fund appoints authorised participants, or market makers, who quote buy and sell prices on the exchange. They, and very large investors, can also create or redeem units directly with the fund in creation-unit size. The Axis document sets that large-investor threshold at transactions above ₹25 crore. When the market price runs ahead of NAV, they can create fresh units and sell them; when it falls below, they can buy units cheap and redeem them. That arbitrage pulls the two prices back together, most of the time.
Most of the time is the key phrase. When silver moves sharply and demand for units suddenly jumps, the market price can sit above NAV for a while. The 2021 board paper also proposed that gold and silver ETFs disclose an indicative intraday NAV on a continuous basis, and that number is your best friend before you place an order.
Worked example: paying a premium
These are made-up round numbers, chosen only to show the arithmetic.
- The indicative NAV of a silver ETF is ₹150.00 per unit.
- Because of a sudden rush of buyers, the last traded price is ₹153.00.
- Premium = (153 − 150) ÷ 150 = 2.0% above what the silver is worth.
Say you buy 200 units at ₹153, paying ₹30,600. A month later silver is unchanged, the rush has faded and units trade at NAV of ₹150. Your 200 units are now worth ₹30,000. You have lost ₹600, about 2%, without silver moving at all. Using a limit order near the indicative NAV, rather than a market order, is the simple defence.
Tracking error, tracking difference and the 2% line
The 2021 board paper defined tracking error for silver ETFs as the standard deviation of the difference between the price of silver and the fund’s NAV, and proposed that it should not exceed 2% for both gold and silver ETFs, barring force majeure. It also proposed that funds disclose tracking difference, the plain gap between the fund’s return and the return of the underlying metal.
Tracking error tells you how wobbly the fund is relative to silver. Tracking difference tells you how much you actually lost to the fund over a period. For a buy-and-hold investor, the second number matters more.
Worked example: reading tracking difference
Again, hypothetical figures:
- Over one year, the domestic silver benchmark rises 12.0%.
- Fund A’s NAV rises 11.4%. Tracking difference is 0.6 percentage points.
- Fund B’s NAV rises 11.8%. Tracking difference is 0.2 percentage points.
On ₹1,00,000 invested, Fund A ends the year at ₹1,11,400 and Fund B at ₹1,11,800. Same metal, same year, a ₹400 gap. Most of that gap usually comes from expenses, with cash drag and the cost of buying and storing bars making up the rest. Over ten years the difference compounds, which is why picking a fund on unit price or brand alone is a poor idea.
What you pay to hold it
The board paper set the ceiling: a silver ETF’s total expense ratio, including management fees and the cost of storing and handling silver, may not exceed 1% of daily net assets. The Axis document shows the same maximum, up to 1.00%. Actual charges are often well below the cap, and fund houses publish their current TER on their websites. Check the current figure rather than relying on the maximum.
Beyond the TER, count these:
- Brokerage and exchange charges on every buy and sell, as with any share.
- The bid-ask spread. A thinly traded ETF can have a wide gap between the best buy and sell quotes, and you pay half of it each way.
- Exit load. The Axis document lists the exit load as nil. Check your fund’s own document.
- Tax. Tax rules on ETF gains change from time to time, so confirm the current treatment for your holding period with a tax adviser before you sell.
Worked example: what the expense ratio costs
Suppose you hold ₹50,000 in a silver ETF with a hypothetical TER of 0.40%, and silver goes nowhere for a year. The fund deducts roughly 0.40% of ₹50,000, about ₹200, spread across the year through a slightly lower NAV each day. At the 1% ceiling, the same holding would cost about ₹500. It sounds small, but on a flat year it is the entire difference between breaking even and losing money.
How fund houses create units, using their own example
The Axis document includes a sample calculation for a market maker creating one block of units, and it is a tidy way to see how cash and metal combine. Its illustrative figures:
- One creation unit: 30,000 units at a NAV of ₹67 each, worth ₹20,10,000.
- Portfolio deposit: 30 kg of silver at ₹66 per gram, worth ₹19,80,000.
- Cash component: ₹20,10,000 − ₹19,80,000 = ₹30,000, paid in cash alongside the metal.
The document stresses these are just example numbers. The point is the structure: the bars carry most of the value, and a small cash top-up covers whatever the fund holds beyond them, such as accrued cash. You will never do this yourself as a retail investor, but it explains why the NAV per unit sits a little above the value of a gram of silver.
Risks the offer document wants you to read
The board paper asked that silver ETF documents spell out specific risks. In plain terms:
- Market risk. The board paper names volatility in silver prices as a risk to disclose. A fund that tracks silver well will fall just as hard as silver when it falls.
- Liquidity can dry up in physical or derivatives markets, making it harder for the fund to buy or sell metal.
- Storage and handling risk comes with holding a physical commodity.
- Tax changes, direct or indirect, can change the value of the metal or the units.
- Currency. Silver is priced globally in dollars, so a weaker or stronger rupee feeds straight into domestic prices even after the shift to exchange-based valuation.
One more thing to plan for is position size. Because silver can swing hard, it usually works better as a small slice of a portfolio than as a core holding. Our guide on risk management in trading covers how to size a volatile position so a bad month doesn’t sink the rest.
Silver ETF versus gold ETF
The plumbing is almost identical. SEBI deliberately modelled silver ETFs on the gold ETF framework, and both now use the same exchange-based valuation. The difference is in the metal. Going by the MCX numbers above, industry used about 832 of the 2,902 tonnes of silver India consumed in 2020, so factory demand is a big part of what drives the price, not just investors and jewellery buyers. If you want the gold side of the story, we have a separate explainer on the gold ETF in India, and a look at how gold and silver react to inflation data.
Same plumbing as a gold ETF, very different metal. Most of the silver India used in 2020 went into factories and jewellery, not into investment.
A short checklist before you buy
- Compare tracking difference over one and three years, not just the TER.
- Look at average daily traded volume and the bid-ask spread. A liquid fund costs less to enter and exit.
- Check the indicative NAV against the market price before ordering, and use a limit order.
- Read the latest offer document and fund house notices, especially on valuation after April 1, 2026.
- Decide in advance how big a slice of your portfolio silver should be, and stick to it.
Silver ETFs remove the worst parts of owning the metal: purity doubts, storage and the jeweller’s spread. What they don’t remove is silver’s habit of moving fast in both directions. Know what the unit holds, what it costs and how far the screen price can stray from NAV, and the product does what it says.
Disclaimer: This article is for education only and is not investment advice. The prices and returns in the worked examples are hypothetical, except where they are quoted from a fund’s own illustration. Please read the scheme documents and consult a SEBI-registered adviser before making any investment decision.

Leave a Reply
Join the conversation
Commenting is open to registered readers. Sign up with just your email — no password needed, and it takes under a minute.
Sign up to comment Log in