
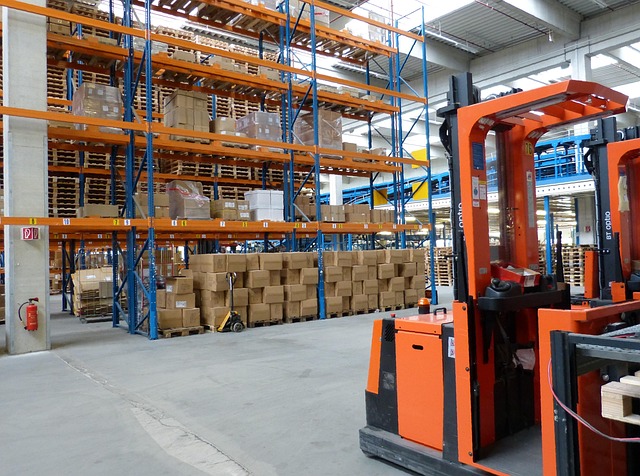



The asset turnover ratio answers a blunt question: for every rupee a company has tied up in assets, how many rupees of sales does it bring in? Two companies can report the same revenue and the same profit, and still be running very different businesses underneath. One might need a giant factory to get there. The other might do it out of a rented warehouse and a few delivery vans. Asset turnover is the number that tells them apart.
We like it because it is boring in a useful way. It doesn’t care about the story management tells on the earnings call. It just divides sales by assets. In this guide we go through the formula, work a few examples in rupees, show where it fits inside DuPont analysis, and flag the situations where the ratio quietly misleads you.
In this article
- What the asset turnover ratio measures
- The formula, piece by piece
- A worked example in rupees
- Compare within an industry, never across
- Where asset turnover fits in DuPont analysis
- Variations you will come across
- The traps: when the asset turnover ratio misleads
- How to read it in a quarterly results season
- Checking the CFI example yourself
- Quick checklist
- Bottom line
What the asset turnover ratio measures
Wikipedia’s entry on asset turnover defines it as a financial ratio that measures how efficiently a company uses its assets to generate sales revenue. It also goes by total asset turnover, or simply “asset turns”. The Corporate Finance Institute’s guide to the asset turnover ratio calls it an efficiency ratio and makes the same basic point: a higher number means the assets are being put to work harder.
Think of a kirana store and a cement plant. The kirana store owns a small stock of goods and some shelves, and it sells through that stock many times a year. The cement plant needs kilns, land, mining rights and heavy machinery worth far more than a year’s sales. Neither is “bad”. They just sit at opposite ends of the asset-intensity scale, and the ratio captures that difference in a single figure.
The formula, piece by piece
The standard version is:
Asset turnover ratio = Net sales ÷ Average total assets
- Net sales is revenue after sales returns, discounts and allowances, as CFI describes it. In an Indian results filing, “revenue from operations” is the usual starting point.
- Average total assets is total assets at the start of the period plus total assets at the end, divided by two. Both numbers come from the balance sheet.
Why average instead of the year-end figure? Because sales are earned through the whole year, while the balance sheet is a snapshot on one date. Averaging the opening and closing figures gives a rough picture of the assets the company actually had at work during the year. Both Wikipedia and CFI note that analysts sometimes just use ending assets instead. That is fine as long as you use the same method every time you compare.
Wikipedia adds a caveat that matters for seasonal businesses: the simple two-point average can give unreliable results when assets swing a lot within the year. A fertiliser company that builds inventory ahead of the kharif season, for instance, might look very different at the end of March than it does in June.
A worked example in rupees
Let’s take a hypothetical consumer company, call it ABC Retail. All figures below are made up for illustration.
- Revenue from operations for the year: ₹1,200 crore
- Total assets at the start of the year: ₹380 crore
- Total assets at the end of the year: ₹420 crore
Average total assets = (380 + 420) ÷ 2 = ₹400 crore.
Asset turnover = 1,200 ÷ 400 = 3.0.
Put plainly, ABC Retail generated ₹3 of sales for every ₹1 of assets on its books during the year.
Now a hypothetical power utility, XYZ Power, with exactly the same ₹1,200 crore of revenue but average total assets of ₹6,000 crore. Its asset turnover is 1,200 ÷ 6,000 = 0.2. It earns 20 paise of sales per rupee of assets.
Same top line. Fifteen times the difference in asset turns. That gap doesn’t mean ABC is the better investment. It means the two businesses make money in completely different ways, which brings us to the most important rule about this ratio.
Asset turnover only makes sense next to a peer. A turnover of 0.2 can be perfectly healthy for a power utility and a warning sign for a retailer.
Compare within an industry, never across
CFI is direct about this: comparing the ratio across very different industries doesn’t give good insight, and it is only appropriate to compare companies in the same industry. The reason is capital intensity. CFI notes that capital-intensive industries tend to report lower ratios, while industries with low profit margins tend to generate higher ones. Wikipedia makes a similar observation, pointing out that retail companies tend to have very high turnover ratios, which it puts down mainly to cut-throat competitive pricing.
So a sensible use looks like this: line up three or four listed companies in the same sector, compute the ratio for each over the same years, and ask why the outliers are outliers. Is one company running older, fully depreciated plants? Did another just commission new capacity? Is a third sitting on a pile of cash that inflates its asset base? The ratio raises the question. The annual report usually answers it.
Where asset turnover fits in DuPont analysis
Asset turnover is one of the three building blocks of return on equity. Wikipedia notes that total asset turnover is used to calculate ROE as part of DuPont analysis. If you haven’t seen the breakdown before, our explainer on DuPont analysis walks through it in detail. The short version:
ROE = Net profit margin × Asset turnover × Equity multiplier
The first two together give return on assets. Here is how our two hypothetical companies might stack up:
| Hypothetical company | Net margin | Asset turnover | Return on assets |
|---|---|---|---|
| ABC Retail | 3% | 3.0 | 9% |
| XYZ Power | 15% | 0.2 | 3% |
ABC’s margin is thin, but it turns its assets fast, so it ends up with a 9% return on assets (3% × 3.0). XYZ keeps far more of each rupee of revenue, yet its slow asset turns drag return on assets down to 3% (15% × 0.2). If both used debt so that assets were twice equity, an equity multiplier of 2, ROE would come out at 18% for ABC and 6% for XYZ.
This is why a margin story on its own can mislead. A company that boasts about expanding margins might be doing it by piling on assets that don’t produce proportionate sales. Asset turnover catches that.
Variations you will come across
Fixed asset turnover
Wikipedia notes that asset turnover can be split into fixed asset turnover, which looks at how a company uses its fixed assets to generate revenue. The formula swaps total assets for net fixed assets (property, plant and equipment after depreciation). It is the more useful version for manufacturers, because it isolates the plant and machinery, which is where most of the capital goes.
Working capital turnover
The other split Wikipedia mentions is working capital turnover, which relates revenue to working capital (current assets minus current liabilities). If you want to go one layer deeper, inventory is often the biggest moving part, and our piece on inventory days covers how to read it.
Operating asset turnover
CFI describes an operating asset turnover ratio that strips out assets not used in day-to-day operations. Its example is a company holding vacant land, which the analyst removes before dividing. In India, the usual suspects are idle land banks, large investments in group companies, or a big treasury of cash and liquid funds. Taking those out gives a cleaner read on how well the actual business uses what it runs on.
The traps: when the asset turnover ratio misleads
1. A big plant just came on stream
Capex lands on the balance sheet before the sales it is meant to produce. Here is a hypothetical manufacturer over three years:
| Year | Revenue (₹ cr) | Opening assets (₹ cr) | Closing assets (₹ cr) | Average assets (₹ cr) | Asset turnover |
|---|---|---|---|---|---|
| Year 1 | 900 | 450 | 500 | 475 | 1.89 |
| Year 2 (new plant commissioned) | 1,000 | 500 | 800 | 650 | 1.54 |
| Year 3 (plant running) | 1,500 | 800 | 820 | 810 | 1.85 |
Read Year 2 in isolation and you would think efficiency fell off a cliff. It didn’t. The company spent money on capacity that hadn’t started selling yet. By Year 3 the ratio is almost back where it was, on a much bigger revenue base. So always read at least three years together, and check the capex commentary in the annual report before drawing conclusions.
2. A cash pile inflates the denominator
Say a hypothetical company has ₹1,000 crore of total assets, of which ₹300 crore is cash and liquid investments, and revenue of ₹1,500 crore. Headline asset turnover is 1.5. Take the cash out and the operating business turns over 1,500 ÷ 700, about 2.14. A cash-rich company can look less efficient than it really is on the plain ratio.
3. Seasonality and the two-point average
As Wikipedia points out, averaging just the opening and closing balances can be unreliable for businesses with big swings within the year. If the company publishes a mid-year balance sheet, averaging in that extra data point gives a steadier picture.
4. Old, depreciated assets flatter the ratio
A plant bought 20 years ago sits on the books at a fraction of what it would cost to build today. A company running such assets will show a high turnover simply because the denominator is small. That looks great until the plant needs replacing and the asset base, and the ratio, reset overnight.
5. Accounting choices shift the base
Leases are a good example. When leases are recorded on the balance sheet as right-of-use assets, total assets go up and the ratio drops, even though the business hasn’t changed. Our explainer on lease liabilities in results covers how that works. Revaluations and large acquisitions closed near year-end can distort the number in similar ways.
A falling asset turnover is a question, not a verdict. Fresh capex, a cash pile or a late acquisition can all drag it down without anything being wrong with the business.
How to read it in a quarterly results season
Asset turnover is an annual measure at heart, but you can still use it while reading results. A few practical habits:
- Annualise carefully. If you only have half-year revenue, double it before dividing by assets, or better still use trailing twelve-month revenue.
- Use a mid-year balance sheet when there is one. If the half-year results include a statement of assets and liabilities, that gives you a mid-year asset figure to average in.
- Pair it with margins. A rising ratio with falling margins can mean the company is chasing volume through discounting. A rising ratio with stable margins is the better sign.
- Watch receivables and inventory. CFI lists obsolete inventory, sluggish sales and slow collections as things that can lower the ratio. If turnover is slipping, those two lines are the first place to look.
If you want the bigger framework for reading a results filing, our guide on how to analyse quarterly results of a company puts asset efficiency alongside revenue, margins and cash flow.
Checking the CFI example yourself
It helps to run one published example by hand. CFI’s worked case has a company with beginning total assets of $199,500, ending total assets of $199,203, sales of $325,300 and sales returns of $15,000. Net sales are 325,300 minus 15,000, which is $310,300. Average assets are (199,500 + 199,203) ÷ 2, or $199,351.50. Divide and you get roughly 1.56, which CFI reads as about $1.56 of sales for every dollar of assets. The currency doesn’t matter. The method is exactly what you would apply to an Indian company’s rupee figures.
Quick checklist
- Take revenue from operations for the full year (or trailing twelve months).
- Average opening and closing total assets, and add a mid-year figure if you have one.
- Divide, and repeat for at least three years.
- Compare only with listed peers in the same industry.
- If the number moved sharply, check capex, cash balances, acquisitions and lease accounting before deciding what it means.
- Feed it into DuPont to see whether ROE is coming from margins, asset turns or leverage.
Bottom line
The asset turnover ratio is simple arithmetic, net sales divided by average total assets, but it tells you something margins and headline profit can hide: how much capital a company needs to produce its revenue. High is generally better, low is generally worse, and both statements are only true inside one industry. Read the trend rather than one year, adjust for cash and new plants when they distort the picture, and you have one of the most honest ratios in a balance sheet to work with.
Disclaimer: This article is for education only and is not investment advice. All company names and figures in the worked examples are hypothetical unless attributed to a named source. Please do your own research or consult a SEBI-registered adviser before making any investment decision.

Leave a Reply
Join the conversation
Commenting is open to registered readers. Sign up with just your email — no password needed, and it takes under a minute.
Sign up to comment Log in